Showing posts with label market. Show all posts

Wednesday, March 9, 2016

The Big Short, and loans in the modern day

The movie shows how knowing that something for sure is gonna happen, big money players can negotiate instruments that allow them to make much bigger returns than what one would expect. Let's see. Naively, if you know that the price is going to go down or up 5%, you can make 5% returns. If you find a way to borrow money at a rate <5% of interest payments for that period of time, then you can increase your returns. The typical rate for a trustworthy borrower is 5,69% per year. If you know about 5% price move that's gonna happen over 1/2 a year, then you should borrow as much money as they are willing to lend you and get roughly 4% of that after all. Unfortunately, there's not so many places you can borrow big sums of money for stock market purposes. Maybe it changes when you have a lot of money already, and some legal status, Idk. But in essence, one would not expect that a hedge fund can borrow much more money than what investors already gave to it, or else it would do it all the time. So naively you expect that your returns will still be of order 5% of what your investors gave you, even if you are a hedge fund.

But there are plenty of financial instruments that circumvent it, most of which are not available to simple people. One thing would be leverage. As far as I understand, hedge fund can make an agreement with a broker about investing money 1:20 into this opportunity. Then, if the actual price reaches -5% at any point in that 1/2 a year, hedge fund loses everything. But if it actually goes +5% as expected, hedge fund doubles the money, getting +100% out of known 5% change of a given instrument. Another way of thinking about it: hedge fund finds a person who is willing to make a bet on all this money that the price is not gonna go move 5% that direction.


Christian Bale plays Michael Burry in ‘The Big Short.’
 
PARAMOUNT PICTURES


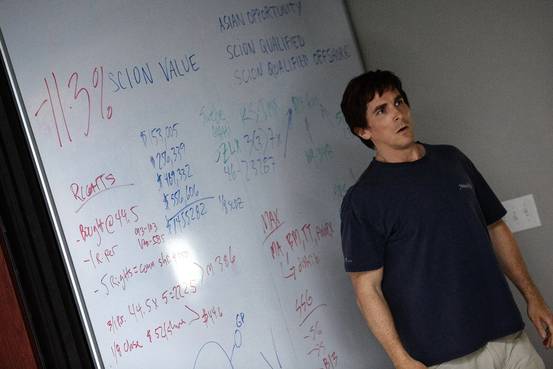
So when one of the main characters (played by Christian Bale?) was drawing numbers on the board: first -119% when the price did something unexpected, but then +440% when it went the way he expected, this is essentially what was happening. The housing prices dropped, say by 60%, after rising by 30%, counting from the moment he shorted the housing market. His bare returns are +30%. If he used the leverage instrument, he needed 1:14 to get his 440%. So he could only afford prices going up by 1/14, or 8%. If they went 9%, he'd lose everything. How could he afford 30% rise on his leveraged short position? And still be only in -119%, not in -440% as the symmetry would suggest?

First of all, he did not put all of his fund's money into shorting the housing market. But that doesn't help: to have 440% returns, he needed to have -440% loss when the price went the opposite direction. Which would bust him. The resolution is that, first, even though the housing market that we see was down by 60%, he shorted some more extreme instruments that were down by almost 100%. Second, to short them, he used Credit Default Swaps, that has been around for decades, just that nobody thought of using them on a housing market.

It is good to note that he made his decision to trade based only only the publicly available information. Using insider's information about upcoming price motions to make money is something you can go to jail for.

Another concept that movie covers are CDO's: a packs of loans that are offered by a bank to investors to provide money for. The movie drives the point home that anyone who was working in the bank on getting those CDO's approved and sold insurance on them was acting completely irresponsible and should go to jail (although almost noone did).

Much blamed CDO's still exist, although in a heavily regulated fashion. Banks still don't do a proper investigation of individual borrowers. However there are web-based platforms Lending club and Prosper that do the bank's job of connecting capital and borrowers without "black boxing" where the money goes. Careful investors can review every single loan app. For big investors, there's even a startup Theorem LP, that's a third party optimization/machine learning that helps quickly scan all the loan requests for reliable ones. They managed to double the return of a naive investment.

Their fees are twofold: there's a 1% fee for putting money into account, and standard hedge fund 10% fee on profits. The minimum account value is 1M$. So essentially what this company is doing is what big banks failed to do during the 2008: carefully review each loan application. It also claims to sometimes provide liquidity to those who want to withdraw (option not available to regular investors on Lending Club), and identify recession years and be even more stringent in the screening during those years. The defaults usually lag 0.5 years behind the economy collapse. Here's a neat data visualization by Bloomberg.

Monday, February 8, 2016

Market is down again

If we believe that investing is still a good idea, then now is the time to move the money there. Of course, one may also be happy about not having investment and keeping the dollars while people who invested are losing money day after day. But this reason to be proud of yourself will disappear as soon as some part of the market shoots up. And it certainly will, problem is, we never know which one. But what do we know?

Under quite a detailed scrutiny, market still looks like a random Markov process. In fact, the more one looks the more indications there are that there are no correlations whatsoever. Correction: you can find correlations, but only such that do not tell you anything about the sign of the price change.

Now, any strategy that can be coded by working with the price data and is a simple looking-back decision making program seems to return essentially random results. There are some that are skewed to perform better, and the dispersion is so big that on some stocks it would seem to perform really well, but it's all just noise. From what we can see, consequence of individual action on the stock market is pretty much 50/50 for most of them, except for particularly stupid ones. In fact, it is hard to find a consistently losing strategy (with 0 fees) because one would invert it (sell instead of buy) and turn it into winning strategy.

The things that are easy algorithmically do not neccessarily coincide with what people actually do while trading by hand. Algorithmically, almost every code that you write makes 100s of operations, while we usually are much more lazy and just want to buy once. So we have confirmed the 50/50 picture for algorithms like trendfollowing and mean-reversion, but these results do not help much in thinking about actually making a trade yourself this one time. So what would be the algorithms that shed some light on the effectiveness of most common trading practices? I hope to list a few things that I have tested here. I have two main interests:


  1. Stop-loss. In B&H strategy, one may take an active position and check how much is the portfolio worth every few days. If he sees that it is down by the last year's earnings, he might impulsively withdraw everything and wait for some time. I'd like to know how it affects the long-term returns (and e.v.) and what wait time and threshold to pick. Also maybe there are stocks that consistently reward traders who use this strategy.
  2. In picking which stocks to invest, one may focus on best performers and worst performers.
  3. The SR is the main instrument in thinking about stock as a random process, but for some of them it does not obey the naive sqrt(Ndays) dependence. In such way one can choose top SR and worst SR stocks, and maybe expect different strategies to work on them.


Thursday, February 4, 2016

Machine learning US investment options

As we remarked in the previous post, assessing the financial promise of a given company or other market instrument is a task for a professional. An amateur may point out one or two obvious things, but will have to guess in pretty much all the major questions. So the natural thought would be to seek out professionals.

There are a few services available with regards to investment:


  1. Portfolio management. There are some calculations based on the past prices and a list of assumptions, which lead to a prescription how much money one should commit to a given type of investment. The central idea is that of diversification: all things cannot fail at once. Or in more mathematical terms, average of N independent random variables will have 1/sqrt(N) smaller standard deviation than each one individually. This slightly improves the performance as compared to s&p 500, and there are plenty of websites that offer this kind of portfolios with formulas hard-coded in: betterment.com, Acorn. Note that such services do not improve the expectation value of your returns, they trade the expectation value for "protection from risk", in other words, apparent reduction in standard deviation of your returns. They save you the nerves during the market crashes. Nobody knows what happens with the actual probability, if that can even be defined (see below). Nice thing about those websites is that they seem to do the rebalancing for you, which also gives a slight improvement over buy&hold of fixed number of shares.
  2. Mutual funds. Those ones will ask you 1$ commission or 0.3%, and attempt to do something that they often do not completely disclose, but possibly more complicated than just portfolio allocation and rebalancing. You can choose the area of the market - there are plenty of mutual funds available for each one. Then the "professionals" who manage the mutual funds decide what to buy and when. Hopefully they can not only improve over blind allocation of portfolio managers, but also time their purchases (or play with the derivatives). However, all of that zoo does not bring them easy victory - as one sees in the websites that show mutual fund's performance, many of them jump like crazy on the scale of 1 year, and it's hard to say conclusively whether their strategy still works. Also, some of them have large barriers to entry (100K$, still not as large as hedge funds)
Most of the intuition in the comparison comes from the simple random process. Such random process would have fixed mean M size of each step, and a much bigger random noise determined by standard deviation S. Let step happen over 1 day. Then after 252 days (roughly 1 year of trading days) the mean/deviation of total returns will be amplified as sqrt(252)*M/S. This number is called Sharpe ratio (roughly). The general logic is that we want to choose a portfolio with the biggest M, but almost all the time the apparent Sharpe ratio of such portfolio will be too small. The mnemonic is that 1/Sharpe^2 is the number of years of data that we need to be confident in our choice. For individual instruments as well as the most of the simple strategies, Sharpe<1, which implies that we need >1 year of uniform data to confirm that our algorithm is working at all. But the problem is, the data on the stock market is strongly non-uniform, especially for B&H strategies. The events every few month strongly influence all the market and change the sentiment about the companies and other instruments. Of course, there are short term changes as well, but the hope is that they repeat often enough so that our training can take them into account. But the month/year scale events tend to be unique and unpredictable. So, in short, our conclusion is that past data alone does not provide sufficient evidence for reliability of any B&H strategy. If that argument was not enough, there's also selection bias that is carefully accounted in Quantopian.com environment, but not in any of the cheesy portfolio allocation formulas.

Still, it's a good sanity check to find out what's your strategy's Sharpe ratio. It's very random, though. Somewhat more stable number is achieved via training-test splitting, optimizing of paramenters on the training and endless crossvalidation on test. We expect that "speculation" strategies can be reliably assessed in this way as they are the ones about timing the purchases, which should be a universal technique largely independent on long-term trends of the market. But B&H strategies are not expected to provide particularly insightful numbers even after the laborious crossvalidation. We will cover a few results for a best performer/worst performer strategies in the next post.

In conclusion, I'd like to note that the above Sharpe ratio analysis relies on the assumption of simple random process, which is in one way definitely not true for the stock market instruments. If the mean M and the dispersion S were as they are measured from the data, typical stock would travel of order S*sqrt(N) from it's origin over N days for N<252/Sharpe^2. But a real stock hardly ever travels that far. If one estimates the anticorrelation coefficient sum(Xi -M) (Xj-M) = sum -0.5(Xi -M)^2 +  0.5(sum Xj- NM)^2 = NS^2, it's almost maximally possible...

Wednesday, February 3, 2016

What to do with the money in US?

A typical choice is either mortgage or retirement fund. Or anything in stock market really. I would like to assess real estate at some point, but currently I don't have enough money to think about it. The low-cost real estate options like REITs don't seem to be very interesting. There's an ongoing REIT in California right now called RichUncles, that seem to be doing some pyramid scheme instead. Its executives spend disproportional amount of money on publicity and high dividends, which makes one suspect they are using their shareholders money for that. Of course, we will only know at their liquidation event that will happen in a few years. They will either be able to pay everybody back, or not. No way to predict. They do publish some sort of financial reports and list of buildings that they buy, but there are not so many figures in those reports, and no plots whatsoever.

Which brings us back to the stock market. Stock market is huge! There are about 7000 instruments on Quantopian.com with  minute data available to analyze: companies, including recent IPOs, and ETFs - a placeholder companies which track some of the government bonds and commodities. What do all of these words mean?
IPO - a moment when company's stock becomes available on the market, as well as the company that recently has done that.
ETF - as explained above.
government bonds - have something to do with the bank interest rates and government borrowing money from citizens.
Commodities - stuff like oil price and gold.

Here's the comparison of all of that stuff over the past year (TLT is bonds, UUP is dollar futures(?), DBC is commodities, S&P 500 is "the market") :
We see that all of them went down, but in somewhat different fashion. Now what investors tend to say is that when the market is low, we need to buy in and hope for it to go up. There are also more advanced talks about rebalancing: one holds a combination of stocks and bonds, and as the stocks go down, buys more stocks and sells more bonds. There are no instructions as to when exactly should one do that. Doing that now sounds like a good idea: bonds are on the uptrend, and the stocks are really cheap. But then, one may argue that waiting for another day, month, year will give one an even better deal as today's trend continues. Nobody really knows when is it gonna revert.

Another direction of work is to try to "outperform the indices". If one carefully picks companies, avoiding the ones with dumb people in the leadership, and the ones with too smart leaders who drain money from stockholders. Avoiding also those that are overpriced, just because every single trader on a stock market wants to buy a bit of Netflix, Google, etc. And avoiding those that have ok leadership, but just not very profitable market (e.g. one-trick companies who only produce one product). After all this avoidance, there's really not much left. Not clear if this is a good strategy as the ability of non-business people to assess financial reports and leadership decisions (as well as the sentiment of institutional investors) is obviously limited. 

Now, in the internet at the end of any such article there's a solution proposed, and a link redirecting the reader to put their money in. I don't have such link at the moment, but I promise that as soon as I set it up I'll share it here. (I hope you see the irony in this paragraph)

Saturday, September 19, 2015

Projections and dispersion of stocks

The picture you don't usually see is how much randomness is in any kind of portfolio:

The actual projection always has dispersion fan coming out of it:
What's needed to calculate the influence is to count the number of buy and sell orders you already sent, that are within the dispersion fan:


Track record: Quantiacs algorithm performance

The Quantiacs trading competition is held every half a year. An algorithm trained on historical data is tested for 3 month. After the winner is determined, the algorithms' performance continues to be public on the Quantiacs website. Here is my current top algorithm's performance on the new data.
U signifies the upload date, after which no changes to the algorithm has been made. The plot shows how the returns of the algorithm survived through the market crash of August 2015.
Trading Days89
Perf.
2.16% (6.34% p.a.)
Volatility4.37%
Sharpe Ratio
1.445
Sortino Ratio
2.183